The Lync Pilot Deployment Health Analysis Tool is a hidden gem in the Lync 2013 Rollout and Adoption Success Kit ( RASK: http://www.microsoft.com/en-us/download/details.aspx?id=37031 ). This tool is designed to display key indicators of the Lync Server infrastructure health. Used to assist in proactively identifying common failure codes and a snapshot of the overall call quality. The original version was part of the Lync 2010 Pilot Success kit ( PSK: http://www.microsoft.com/en-ca/download/details.aspx?id=34965 ).
Pre-Requisites
- Lync Server 2013/2010
- Monitoring Role
- Call Detail Records (CDR) & Quality of Experience (QoE) data capture policies
- Excel 2010/2013 (with Macros enabled)
- Minimum SQL permission for User running the tool is db-datareader for LCSCdr and QoEMetrics databases
Using the Analysis Tool
- Launch the correct version of the Analysis Tool, depending on deployed Lync Monitoring Database version being connected to (Located in the Operations folder in the RASK).

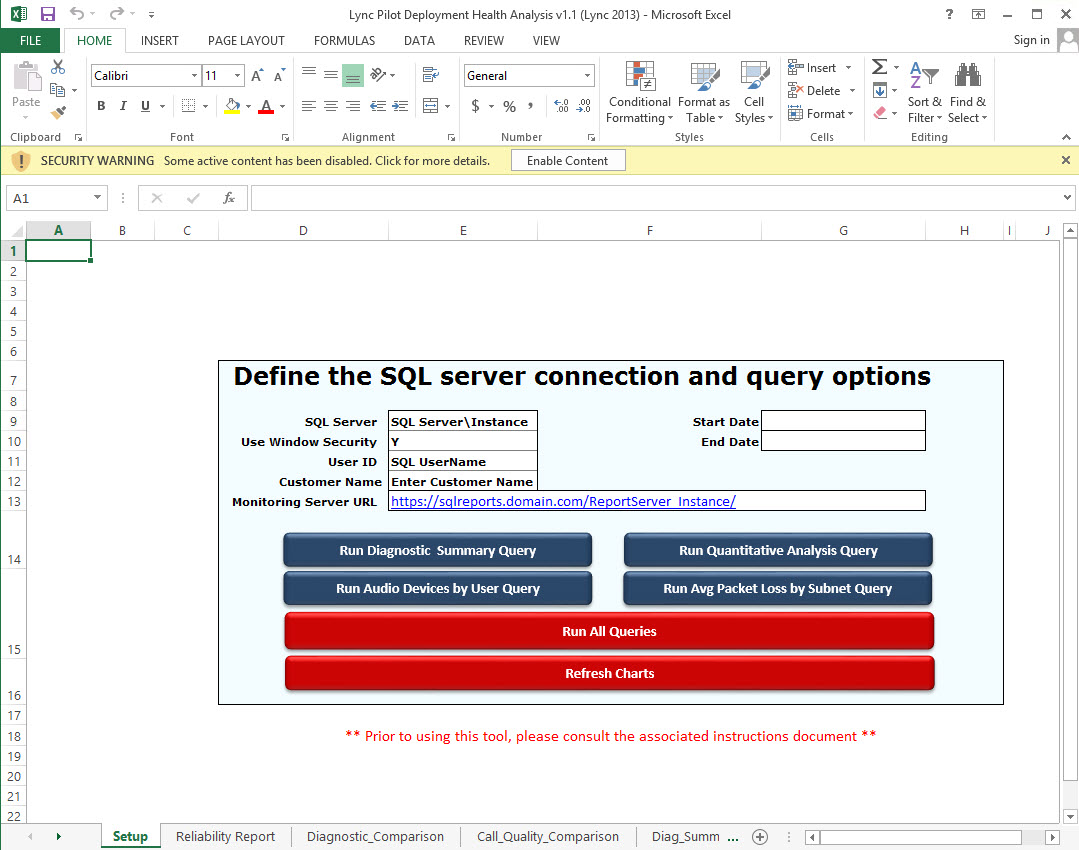
- Setup tab
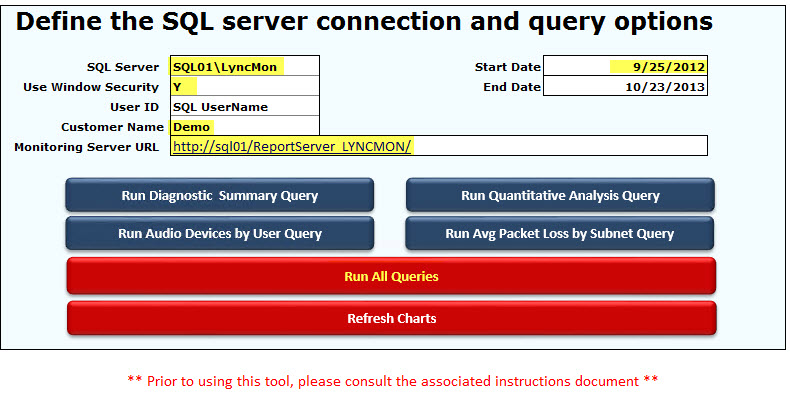
- SQL Server: Name of the Lync Monitoring Database SQL server and named instance if used. i.e. SQL01LyncMon
- Use Windows Security: Select “Y” if using Windows intergrated Security or “N” for SQL authentication from drop-down.
- User ID: Username for SQL authentication. *Field only used if “N” is set for “Use Windows Security”
- Customer Name: Organization name displayed on generated charts.
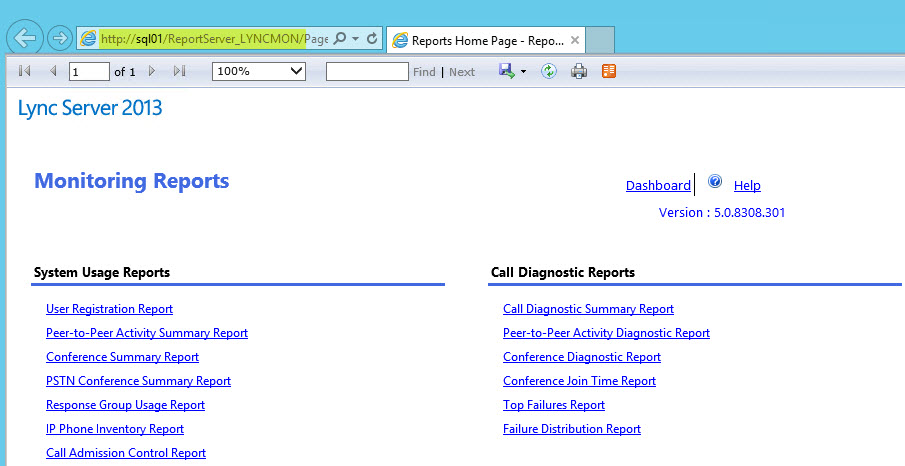
- Monitoring Server URL: Location of monitoring server reports deployment. Used for clickable related report links on data analysis pages. i.e. http://sql01/ReportServer_LYNCMON/
- Start Date: Defines the start date for SQL queries. Default is four weeks prior to current date.
- End Date: Defines the end date for SQL queries. Default is current date.
- Queries: You can choose to run SQL queries individually or all at once.
- Refresh Charts: Used to update charts manually after copying/pasting data into raw data tabs. *See Documentation Appendix for SQL Queries to export raw data using SQL Server Management Studio.
- Reliability Report tab
This tab shows the session success rate for each modality (Application Sharing, Audio, File Transfer, IM and Video) for peer-to-peer sessions and conferences. The Session Success Rate is determined by dividing the number of unexpected failures by the number of sessions for a given week then subtracting that failure rate from 100%.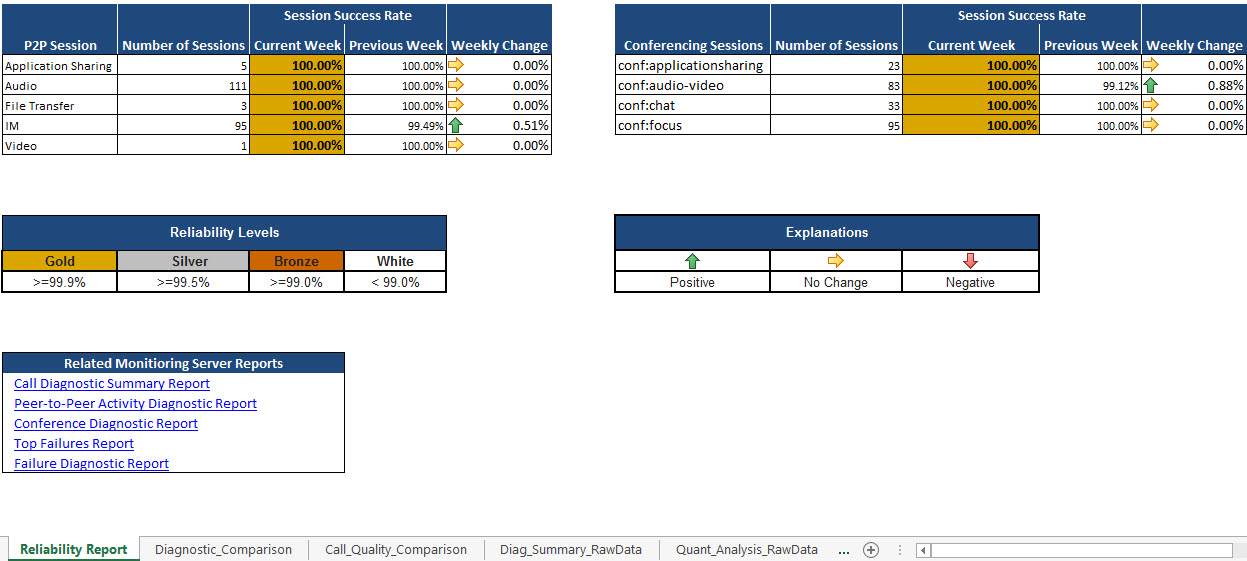
- Diagnostic_Comparison tab
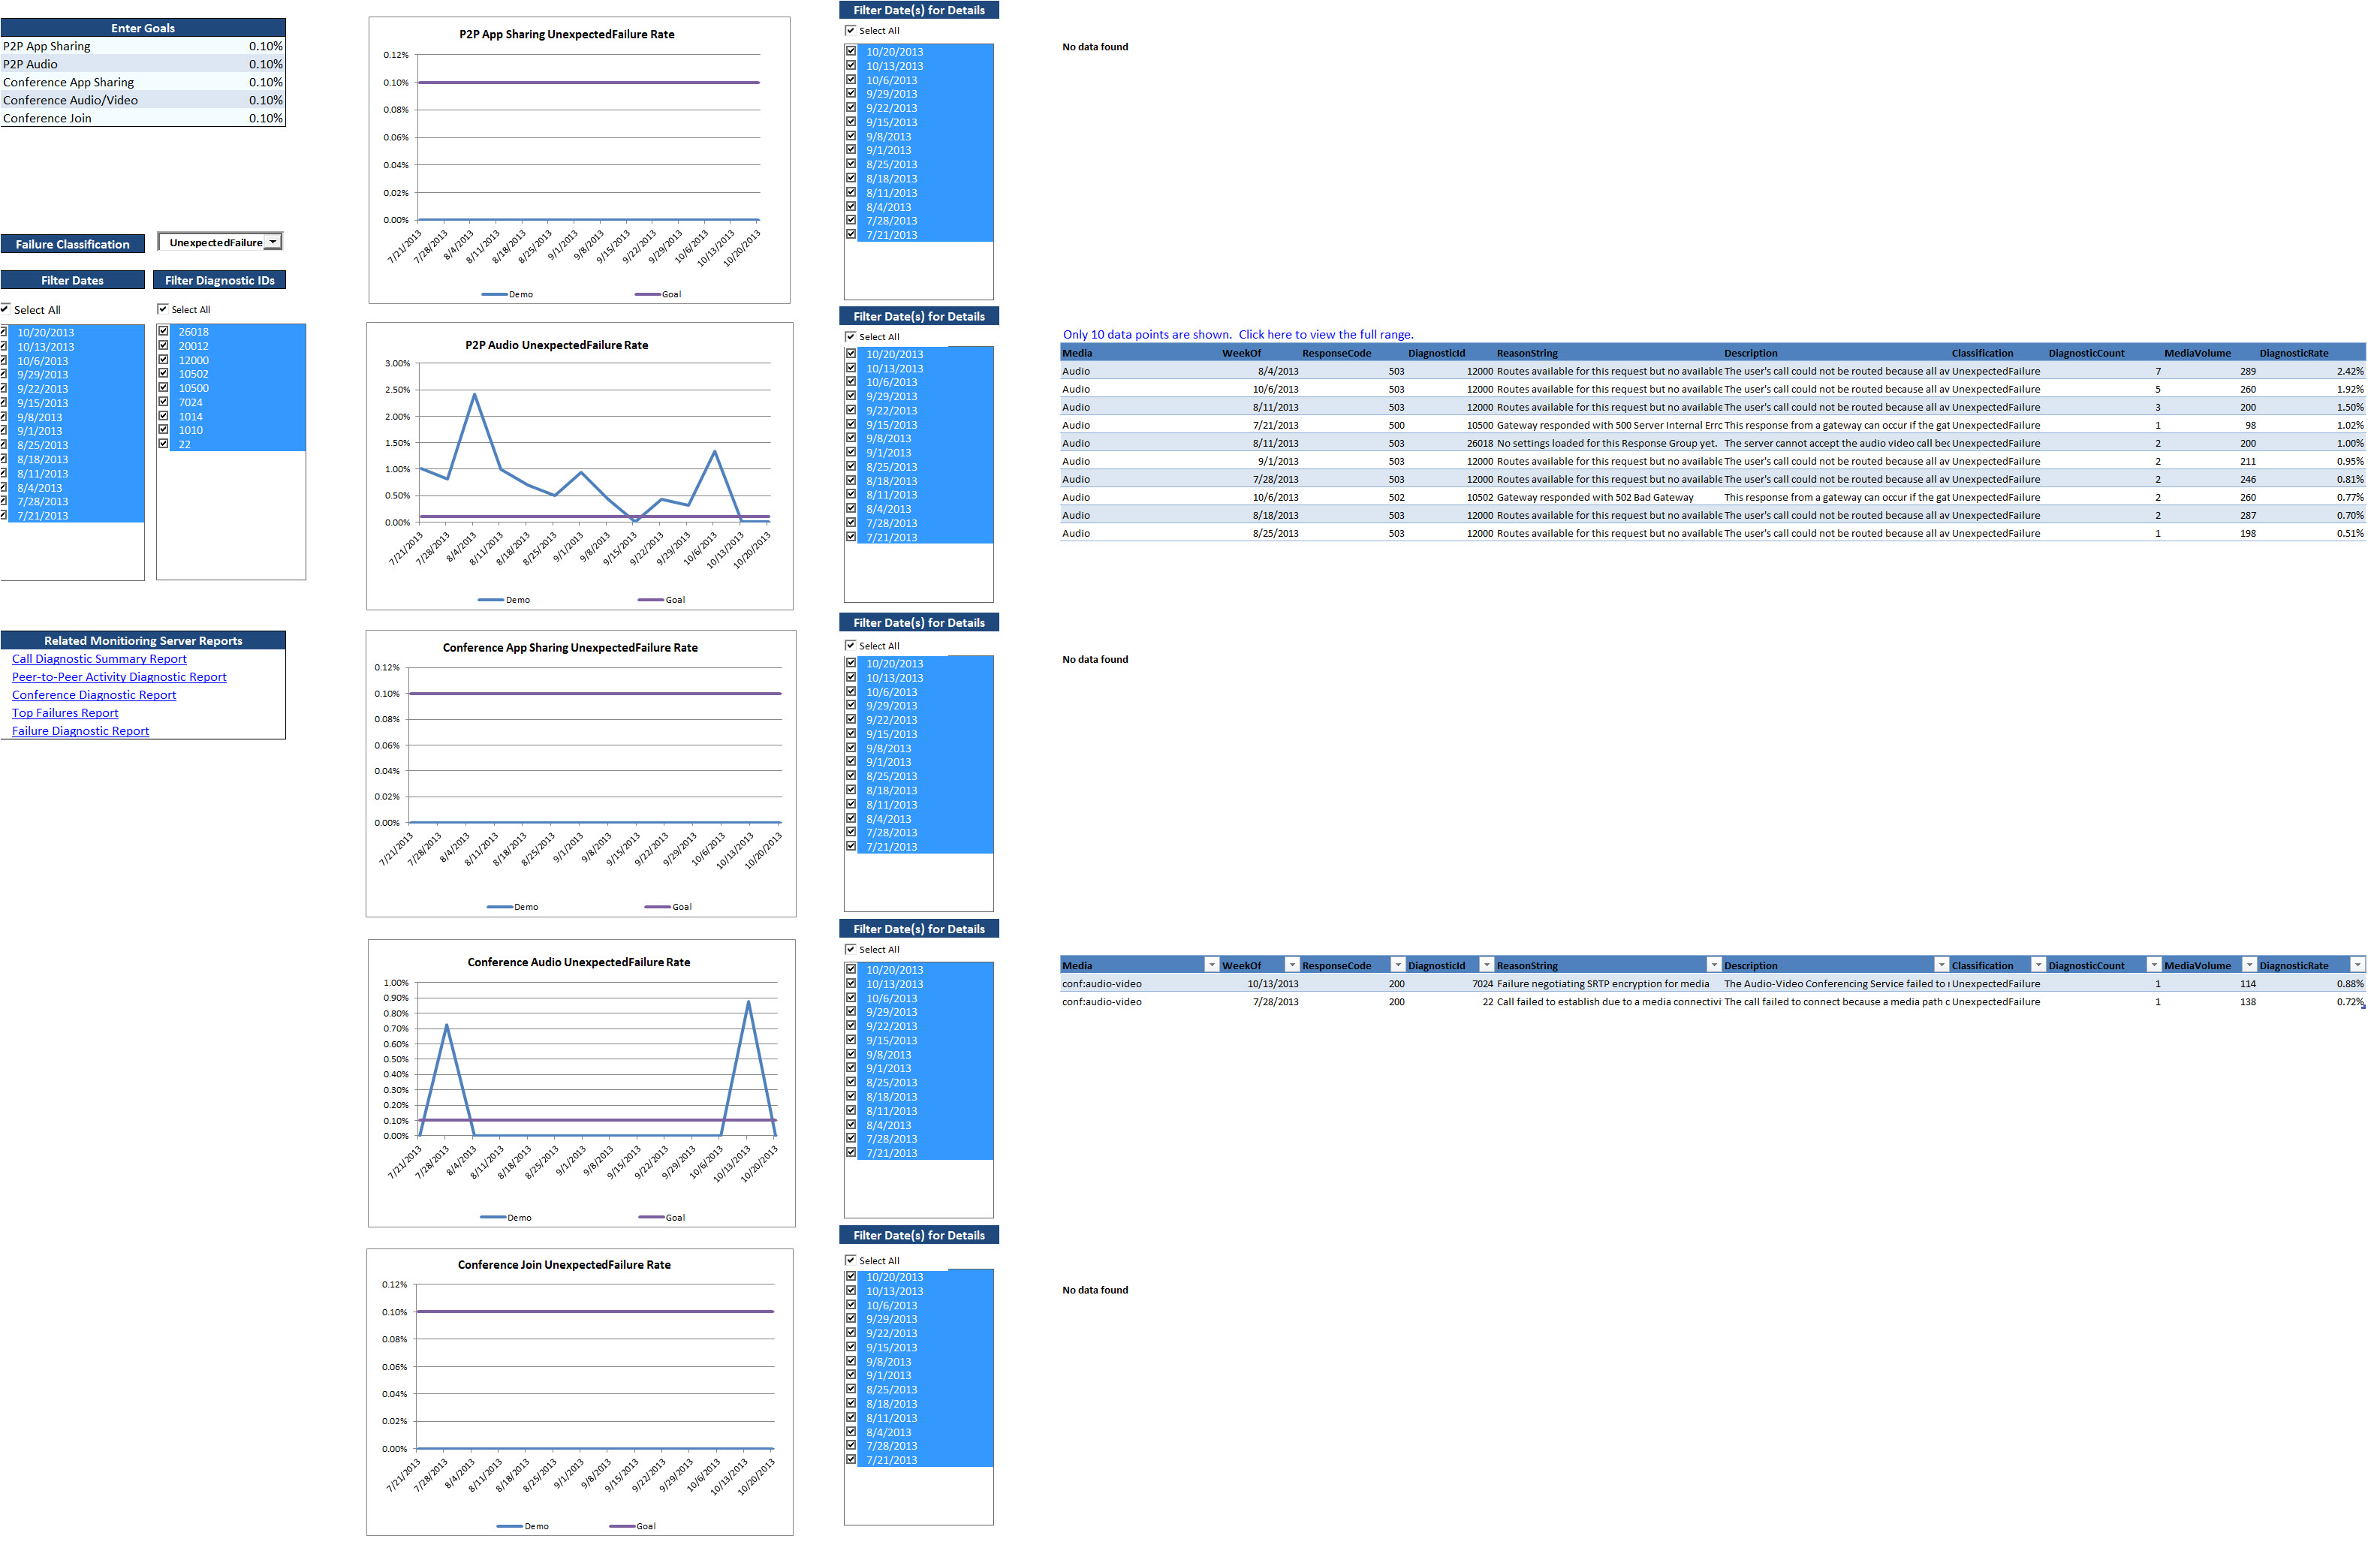
This tab shows the most frequently occurring failures in the deployment. This helps pinpoint deployment issues by listing diagnostic IDs of unexpected failures to be researched.
- Call_Quality_Comparison tab

- Diag_Summary_RawData tab
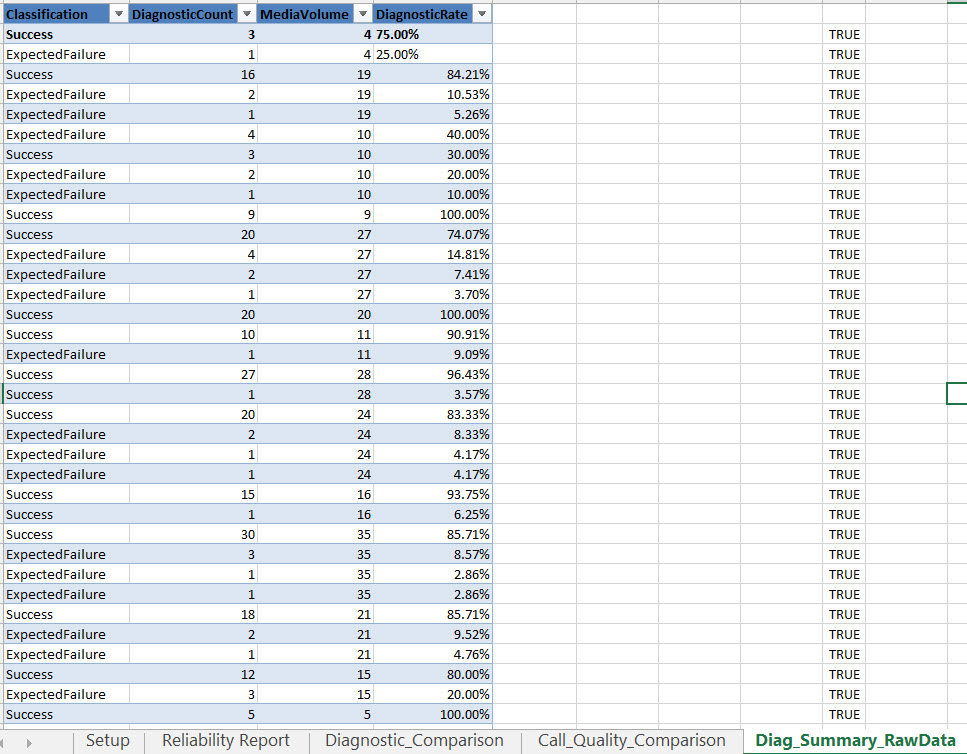
This tab is used for storing data returned from SQL queries used in the Diagnostic_Comparison and Call_Quality_Comparison tabs.
- Quant_Analysis_RawData tab
This tab is also used for storing data returned from SQL queries used in the Diagnostic_Comparison and Call_Quality_Comparison tabs.

- AudioDevicesByUser_RawData tab
This tab is not used in any chart generation but provided as additional data to help troubleshoot identified issues. The data contains which devices users are using for calls and the number of calls with audio problems.

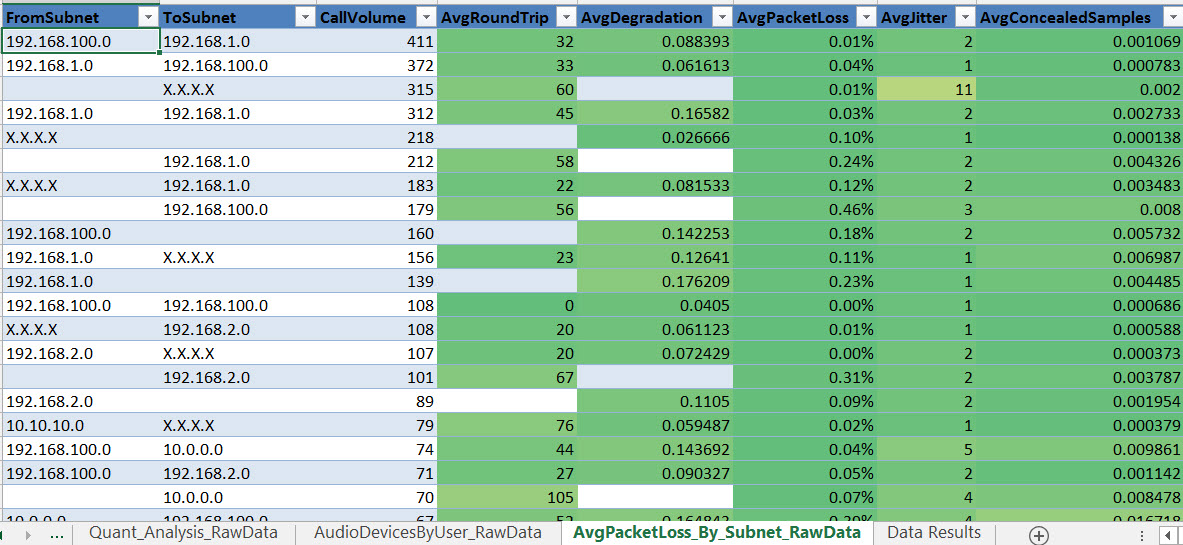
- AvgPacketLoss_By_Subnet_RawData tab
This tab is also not used in any chart generation but provided as additional data to help troubleshoot identified issues. The data contains network statistics for each of the subnets that calls have been initiated or received.
